The Haiti earthquake seen by the US Array network
 Marcin Polkowski
Translated from Polish. Originally published on morony.pl on 17 Jan 2010.
Part 1 of 2 in the series The 2010 Haiti earthquake
- The Haiti earthquake seen by the US Array network
- Haiti earthquake travel-time curve for the whole Earth
I think everyone has heard about the earthquake in Haiti that struck on Tuesday, January 12, 2010. It was a strong, shallow event, so it was well recorded by seismic stations around the world. As it happens, the United States, which lies relatively close to Haiti, is hosting the largest passive seismic experiment in history. More than 400 portable seismic stations are being deployed on a dense grid covering a "belt" that runs across the US from south to north. The belt is gradually being moved from the west coast towards the east coast. Right now the stations are in the middle of the country, as shown on the map I drew below: 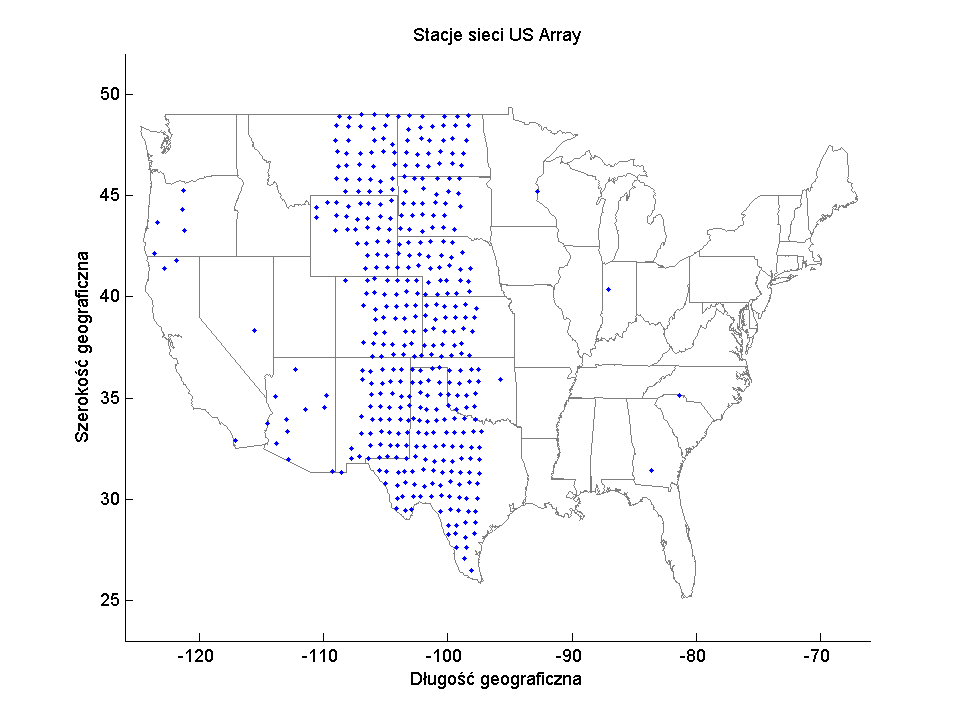 Because the stations used in this experiment are very modern, broadband and professionally installed, the recordings are of high quality – free of noise, artifacts, trends, DC offsets and so on.
With relatively little effort I managed to produce a plot – a record section of this earthquake: 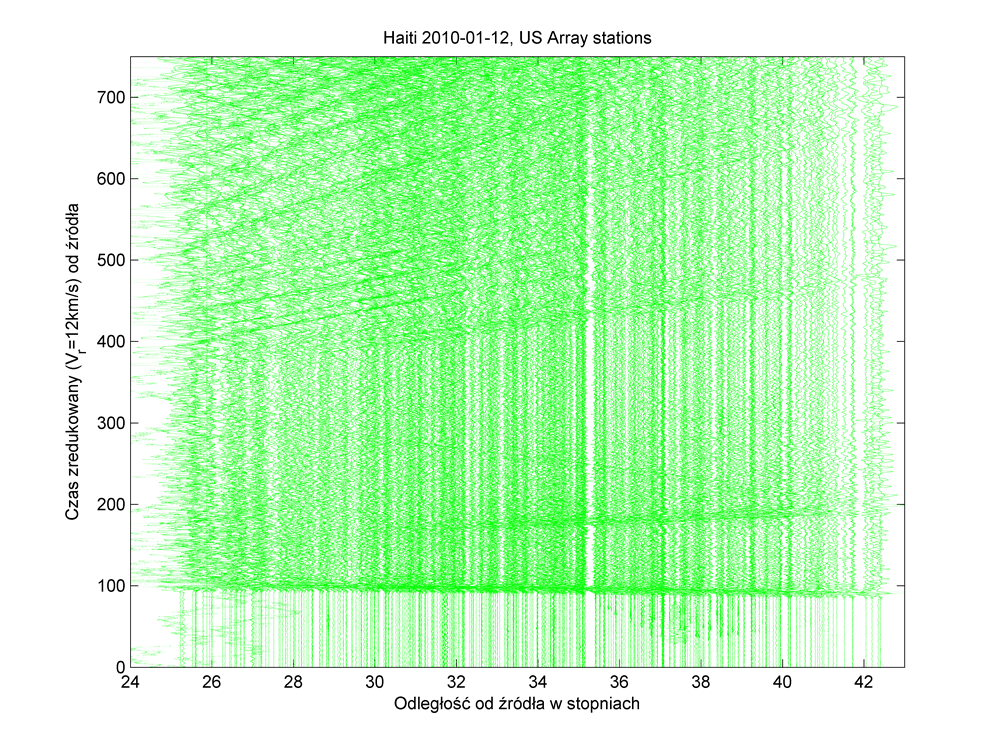 The time on the vertical axis is reduced, and you can beautifully see the arrivals of the P, PP, S waves and so on.
The next, somewhat more complicated step was an animation showing the P-wave front passing across the US. The color of the dots in the animation depends on the displacement of the seismograph's vertical component. The greener the dot, the larger the upward displacement; the redder, the larger the downward displacement. In the animation you can see the P-wave front pass, followed by vibrations caused by the complex structure of the Earth. If the animation doesn't show up below, you can watch it here:
Beautiful, isn't it?
I wonder whether anyone who stops by here appreciates my seismic creations :)?
Next in The 2010 Haiti earthquake: Haiti earthquake travel-time curve for the whole Earth →