How high do planes fly?
 Marcin Polkowski
Translated from Polish. Originally published on morony.pl on 7 Dec 2016.
While going through the regulations on restrictions for drone flights near airports, I started wondering at what altitudes airliners actually fly during takeoffs and landings.
I picked one day (last Monday) and collected information on all the flights over Poland on that day. The data file for the whole day takes up about 370 MB and looks more or less like this:
bbc8f8f,3C5432,55.0600,11.8611,356,34000,354,5412,F-EKEB2,A306,D-AEAR,1480291202,LEJ,OSL,QY3314,0,0,BCS3314,0
bbc663a,394A0B,54.5979,11.8800,52,32000,401,0652,F-EKKL1,B77W,F-GSQL,1480291202,CDG,HND,AF274,0,0,AFR274,0
bbc879c,738076,49.0065,11.9041,120,37000,512,4753,F-ETHF1,B772,4X-ECF,1480291203,LHR,TLV,LY318,0,0,ELY318,0
bbc95e8,40066A,53.9157,12.4301,5,24000,349,6450,F-EDDT2,B752,G-BMRH,1480291202,LEJ,CPH,QY178,0,0,BCS178,0
bbbe339,,50.2147,12.6663,292,40025,385,3253,F-LKPD1,CL60,,1480291203,,,,0,0,CL60,0
bbc715e,406F01,49.8304,12.6811,16,35975,413,1000,F-LKVO1,A320,G-EZOZ,1480291203,BCN,SXF,U24536,0,64,EZY81TC,0
bbc86f4,424293,48.7195,13.1555,114,38975,516,2223,F-LKVO1,B788,VP-BBR,1480291203,LHR,GYD,J28,0,-64,AHY8,0
bbc858c,894070,50.5559,13.2681,112,35000,491,2246,F-LKVO1,A320,A9C-AO,1480291203,LHR,BAH,GF6,0,-64,GFA6,0
We have the flight code, geographic coordinates, altitude, time, departure airport, destination airport, aircraft model and so on. I loaded the complete dataset into MATLAB. First, I plotted all the data: 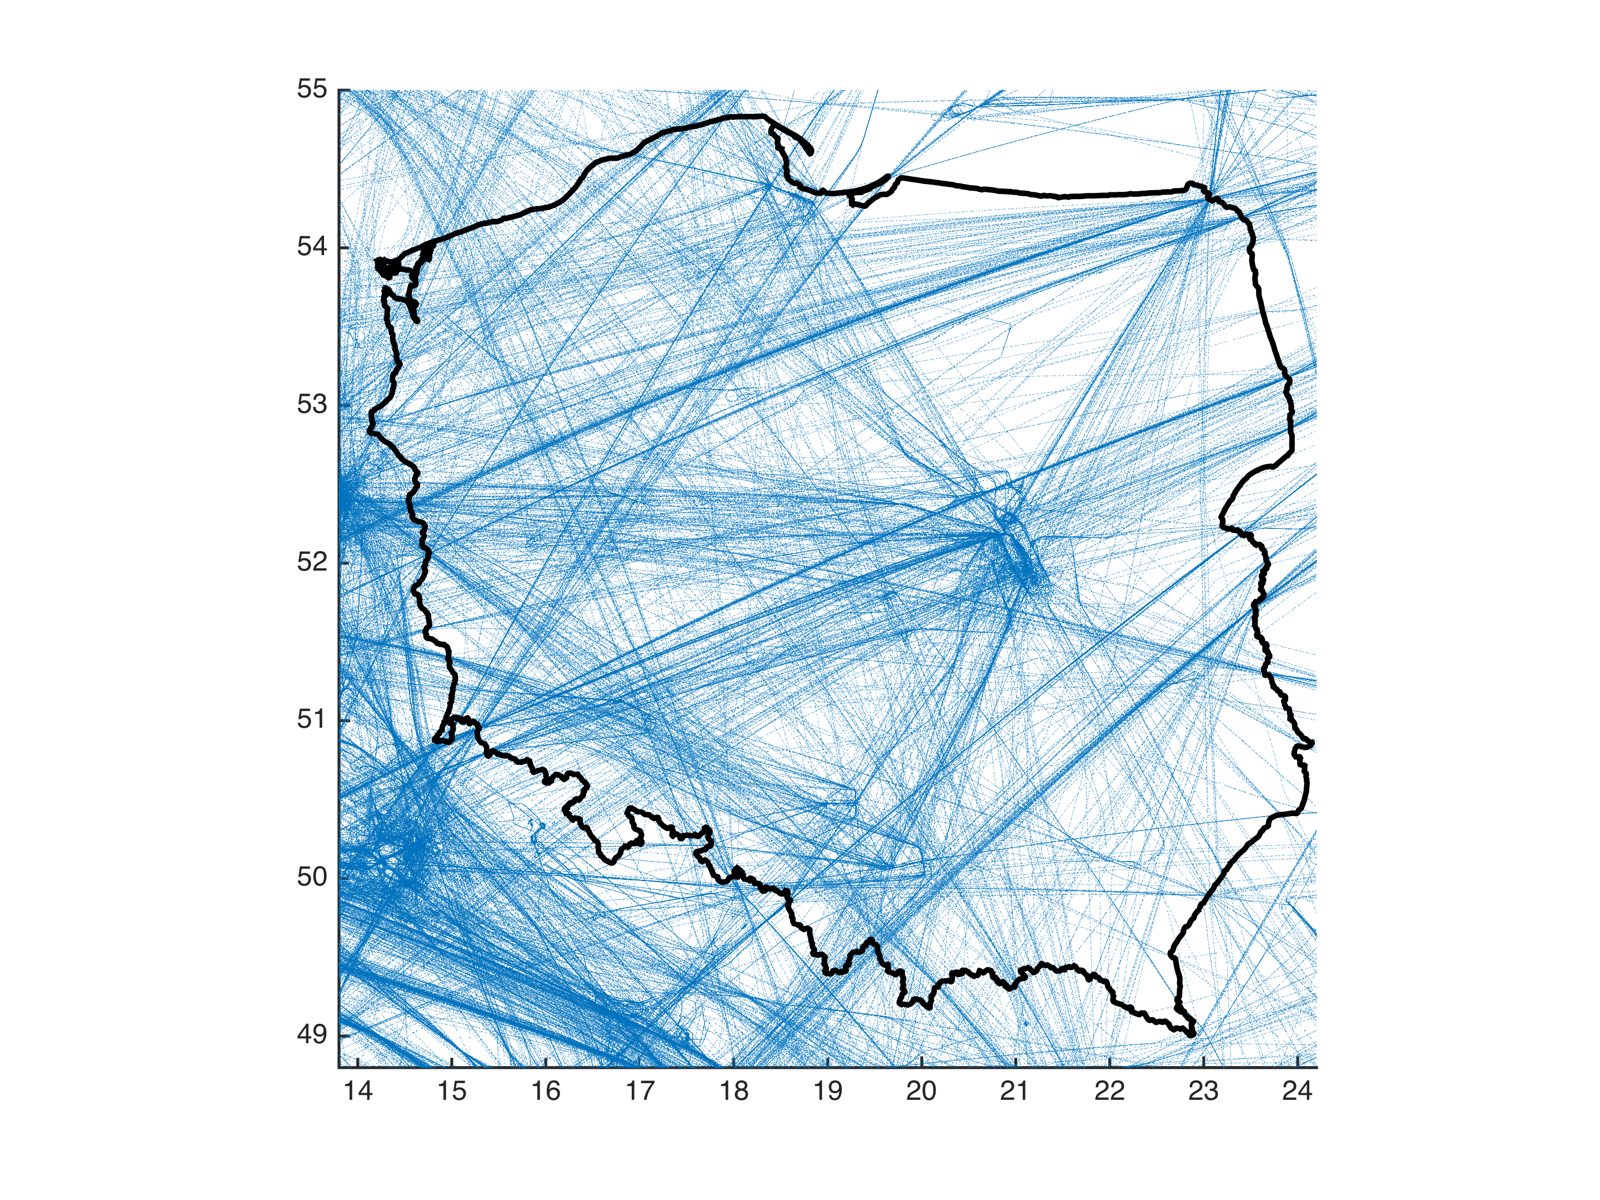
The sheer amount of information on the map is impressive; you can clearly see the heavy traffic around Okęcie. We were going to talk about altitudes, so I color-code the positions on the map by flight altitude. Green is 3 to 2 km, yellow 2 to 1 km, orange 1 km to 500 m, and red below 500 m:
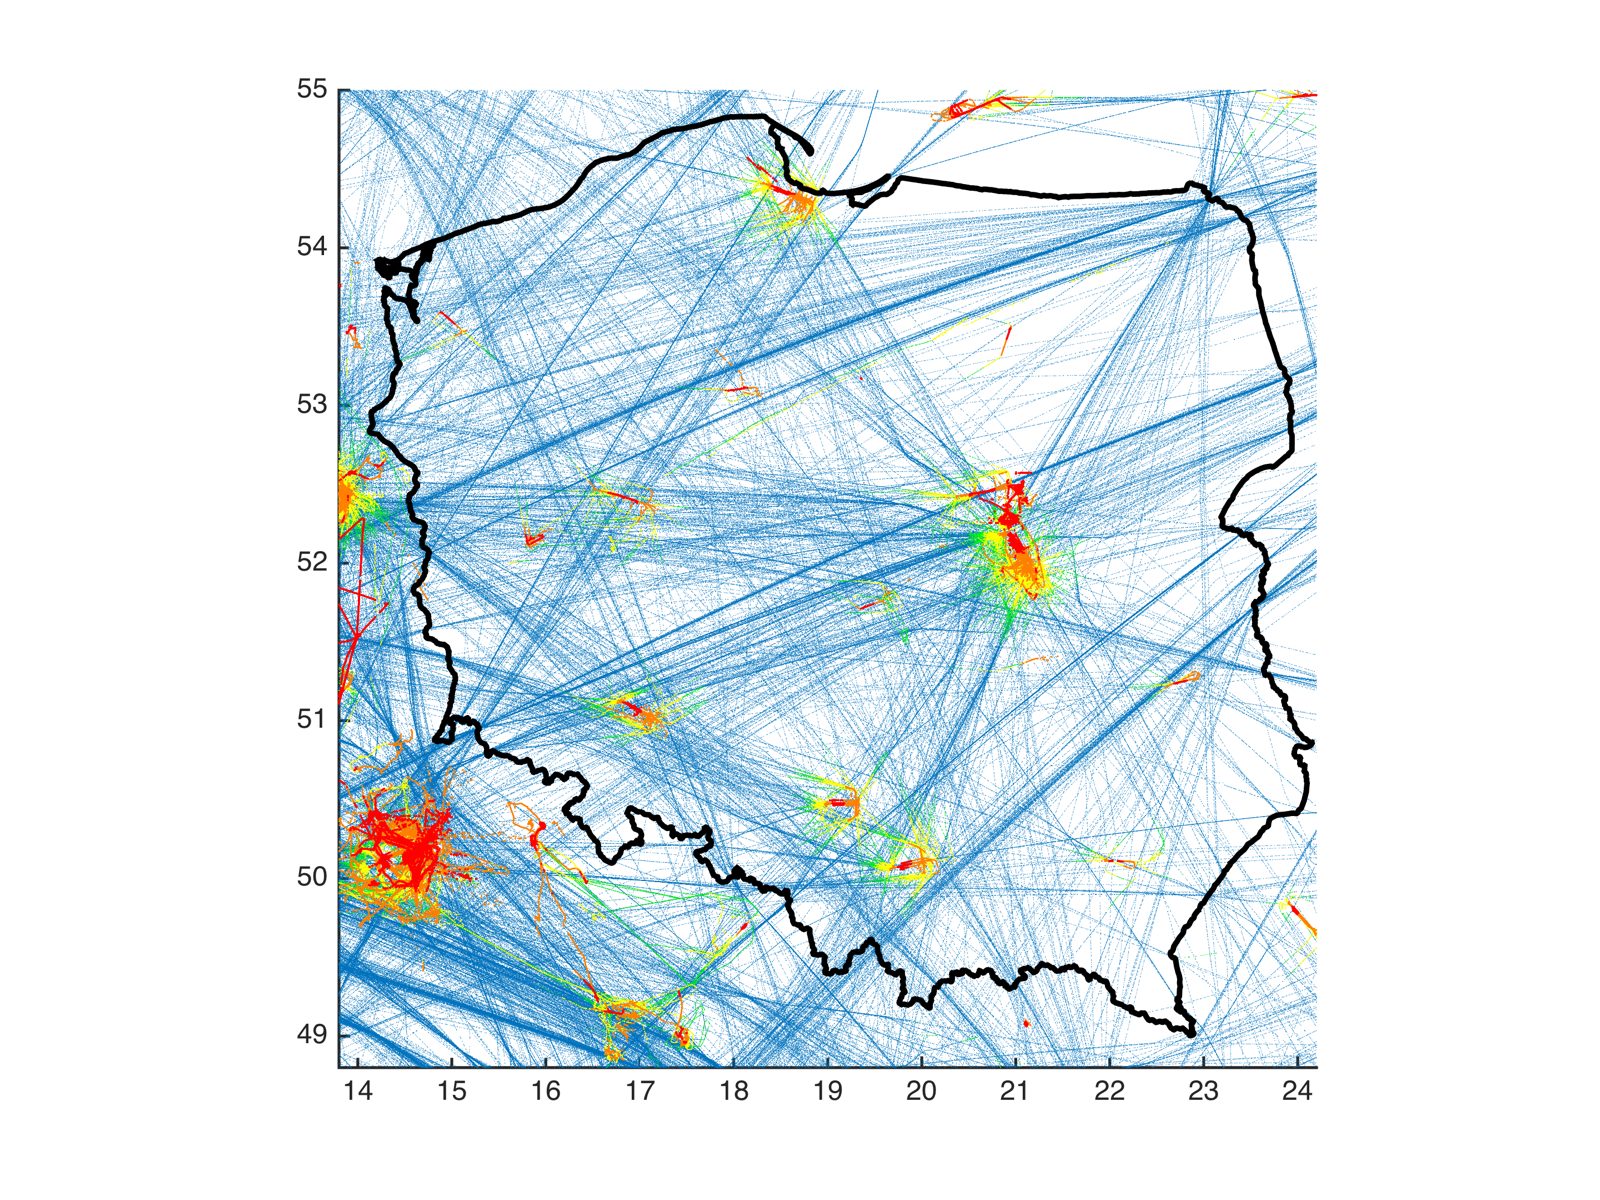
You can see that the area around airports where planes fly low is relatively large. Each airport would need a separate analysis. I got interested in Warsaw's Okęcie. On the plot I marked flight altitude (above ground level) against distance in km from the airport (for Okęcie I measured the distance from the intersection of the runways). The dataset is very large and its accuracy varies, but you can clearly see the difference between the takeoff profile (red) and the landing profile (blue):
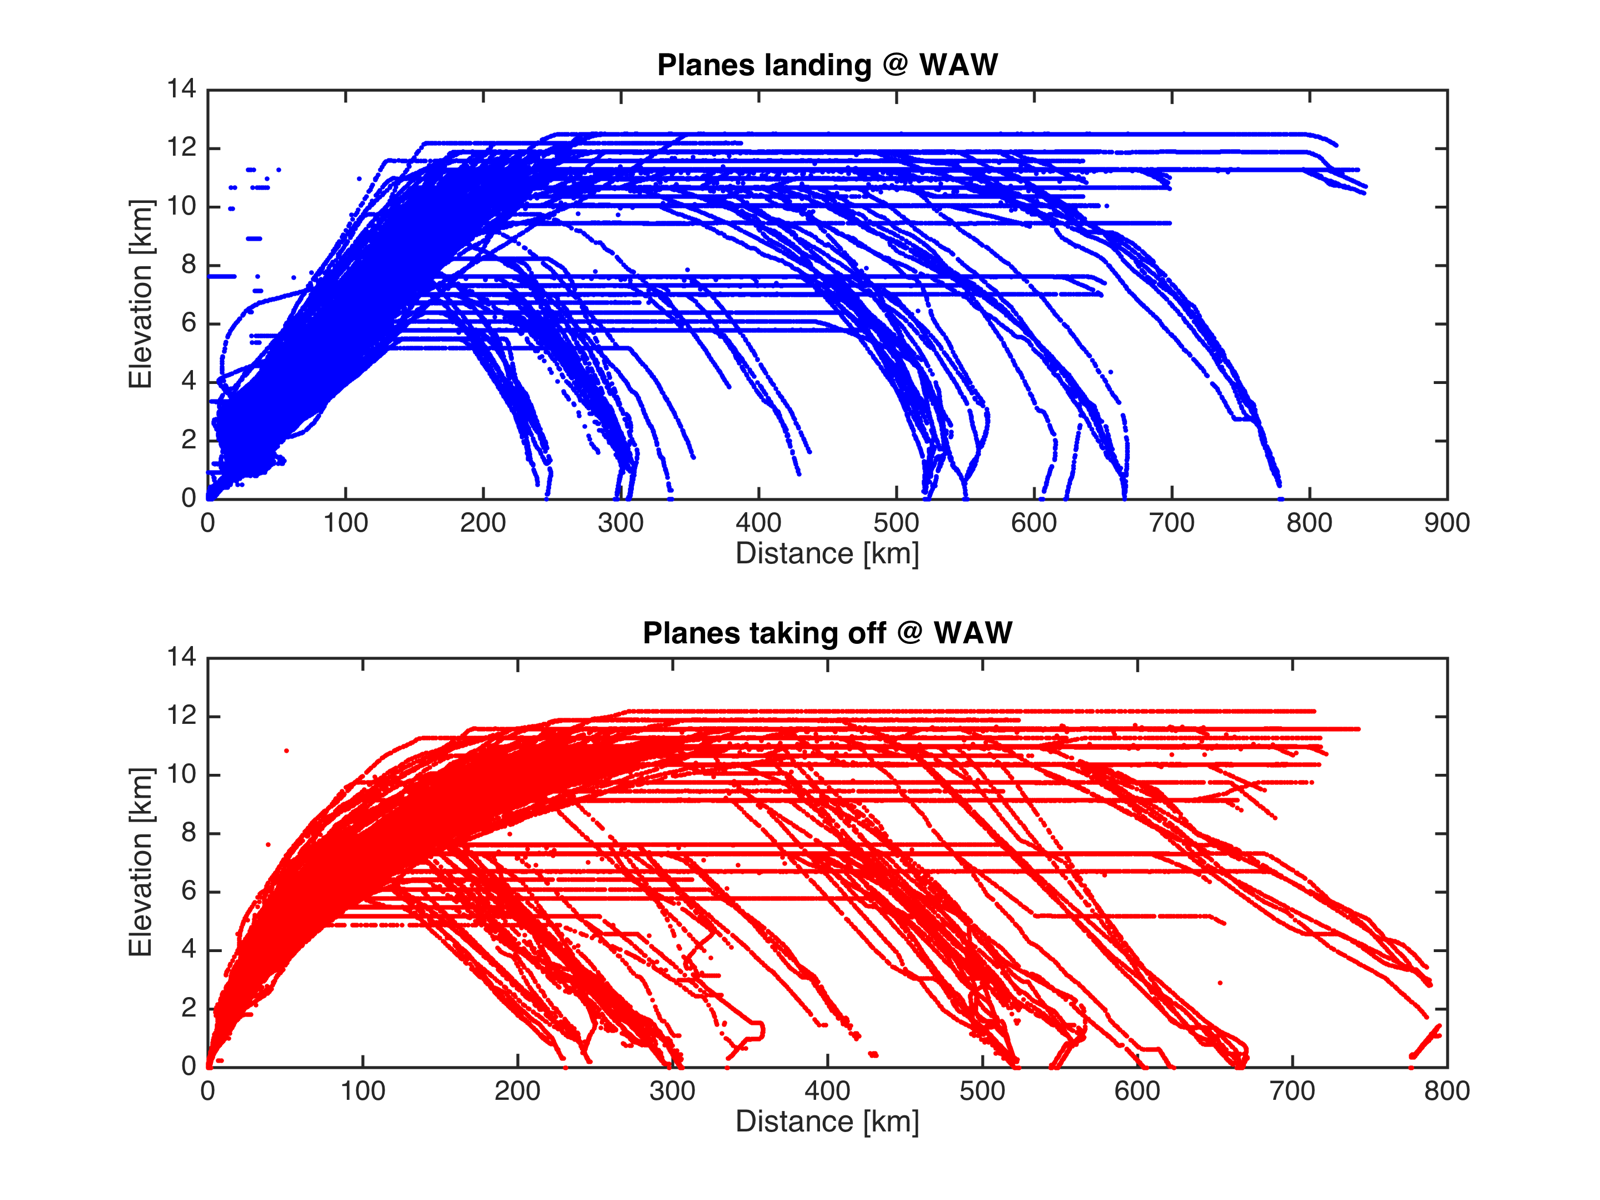
You can clearly see that planes reach different cruising altitudes depending on the length of the flight.
And now the most interesting part – a close-up of the airport itself:
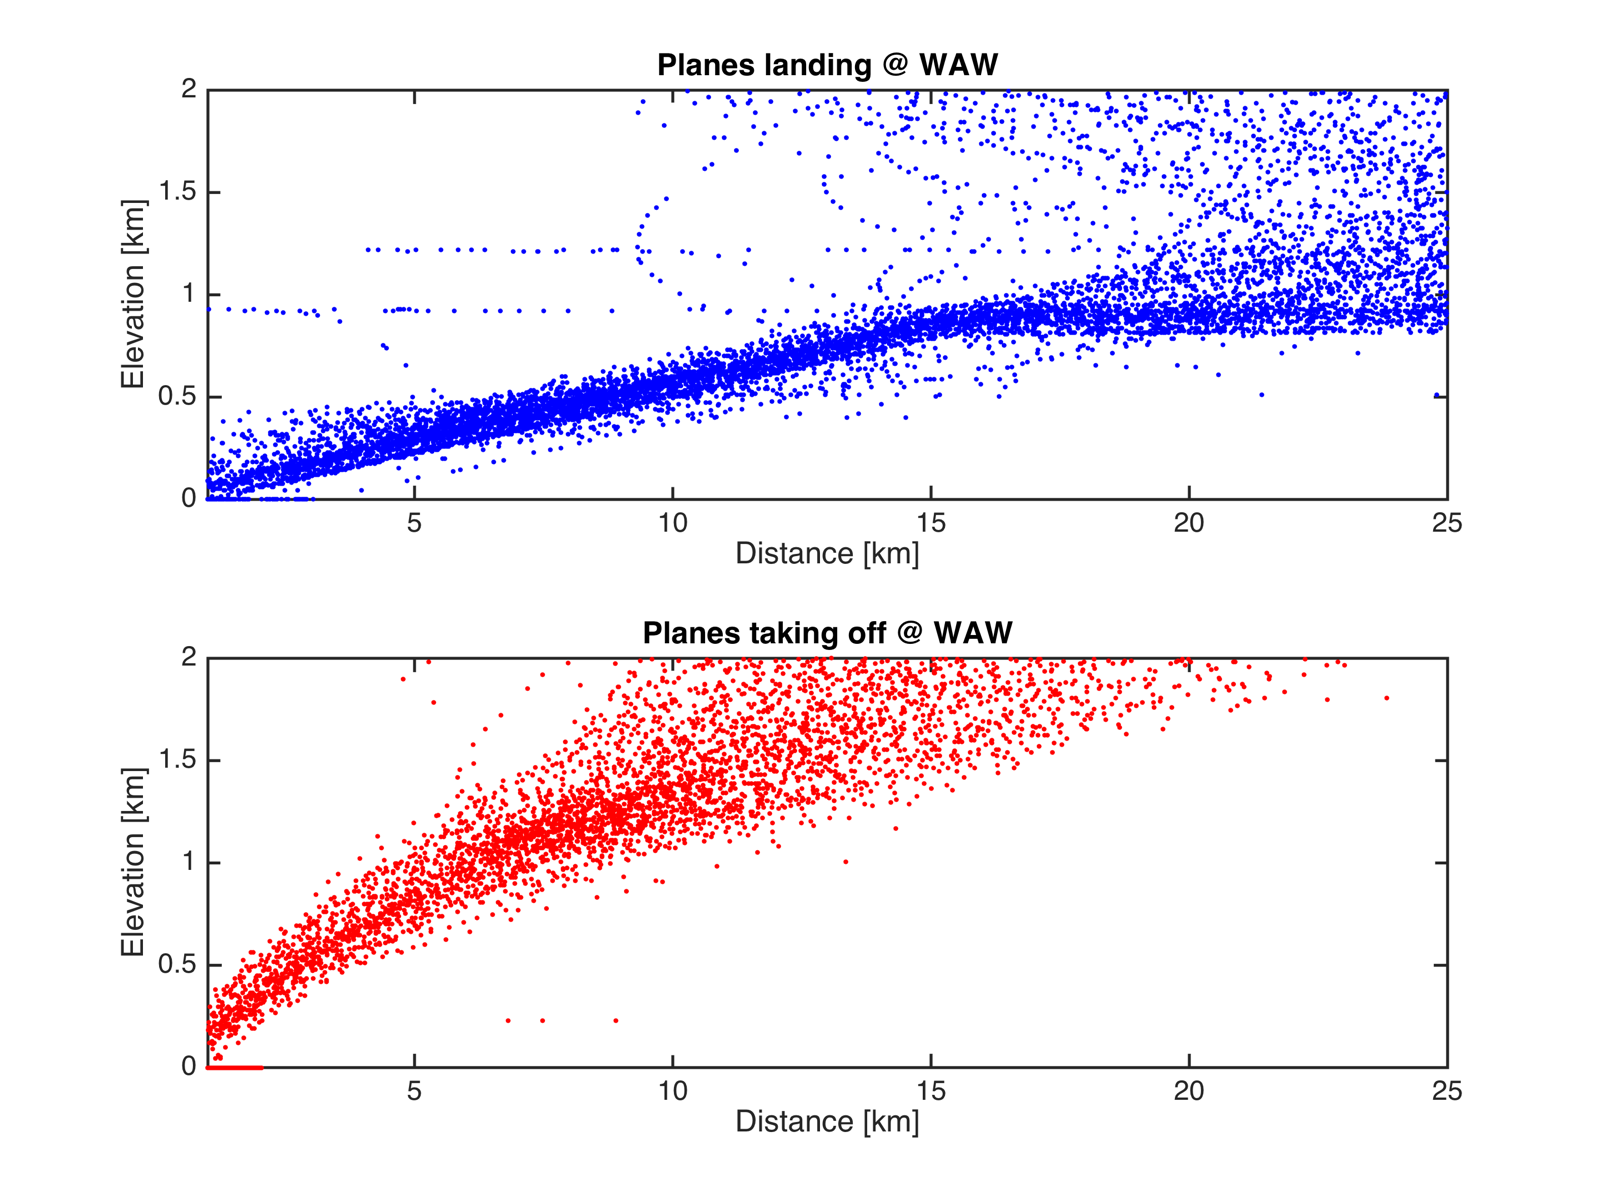
You can clearly see that during landings planes spend longer, and stay farther out, at low altitude. That seems consistent with common sense. If anyone is interested, I can make a plot for another airport. The kink in the landings exactly 15 km from the airport is very interesting – maybe some expert can explain why it looks like that. You'd think the descent would begin gently, but here it seems abrupt.
For those who like code, today I have a piece of MATLAB that draws the plot shown above:
clear;clc;
T = readtable('all2.txt');

%%
airport1 = table2array(T(:,13));
airport2 = table2array(T(:,14));

flight_lon = table2array(T(:,4));
flight_lat = table2array(T(:,3));
flight_elev = table2array(T(:,6));
flight_code = table2array(T(:,1));
flight_elev = flight_elev * 0.3048;

%%
D = distance(52.165802, 20.967240, flight_lat(idx), flight_lon(idx));
D = deg2km(D);

idxs = strcmp(airport1,'WAW');
idxl = strcmp(airport2,'WAW');

Ds = deg2km(distance(52.165802, 20.967240, flight_lat(idxs), flight_lon(idxs)));
Dl = deg2km(distance(52.165802, 20.967240, flight_lat(idxl), flight_lon(idxl)));

clf
hold on
subplot(2,1,1)
plot(Dl,flight_elev(idxl)/1000,'b.')
title('Planes landing @ WAW')
xlabel('Distance [km]')
ylabel('Elevation [km]')
subplot(2,1,2)
plot(Ds,flight_elev(idxs)/1000,'r.')
title('Planes taking off @ WAW')
xlabel('Distance [km]')
ylabel('Elevation [km]')

print(gcf, '-r360', '-dpng', 'wykres1.png');