27 trips to Pomerania, 31,000 km recorded by GPS
 Marcin Polkowski
Translated from Polish. Originally published on morony.pl on 28 Sep 2016.
I've already mentioned the "13 BB star" seismic experiment (I promise to write more about it). As part of the experiment, broadband seismic stations were deployed at 13 sites in Pomerania for 3 years. Since we're based in Warsaw, we had to drive up to Pomerania quite a bit: to plan, install, service and dismantle the stations. The last trip was last week. Since I drove my own car from the very beginning, I needed to record the route with GPS to have documentation for reimbursing the costs. I used two twin receivers for this: the older Garmin GPSmap 60CSx and the newer GPSmap 62sc. On every trip the receiver was always in the car; it switched on when the engine started and logged the position to a file every 1 second.
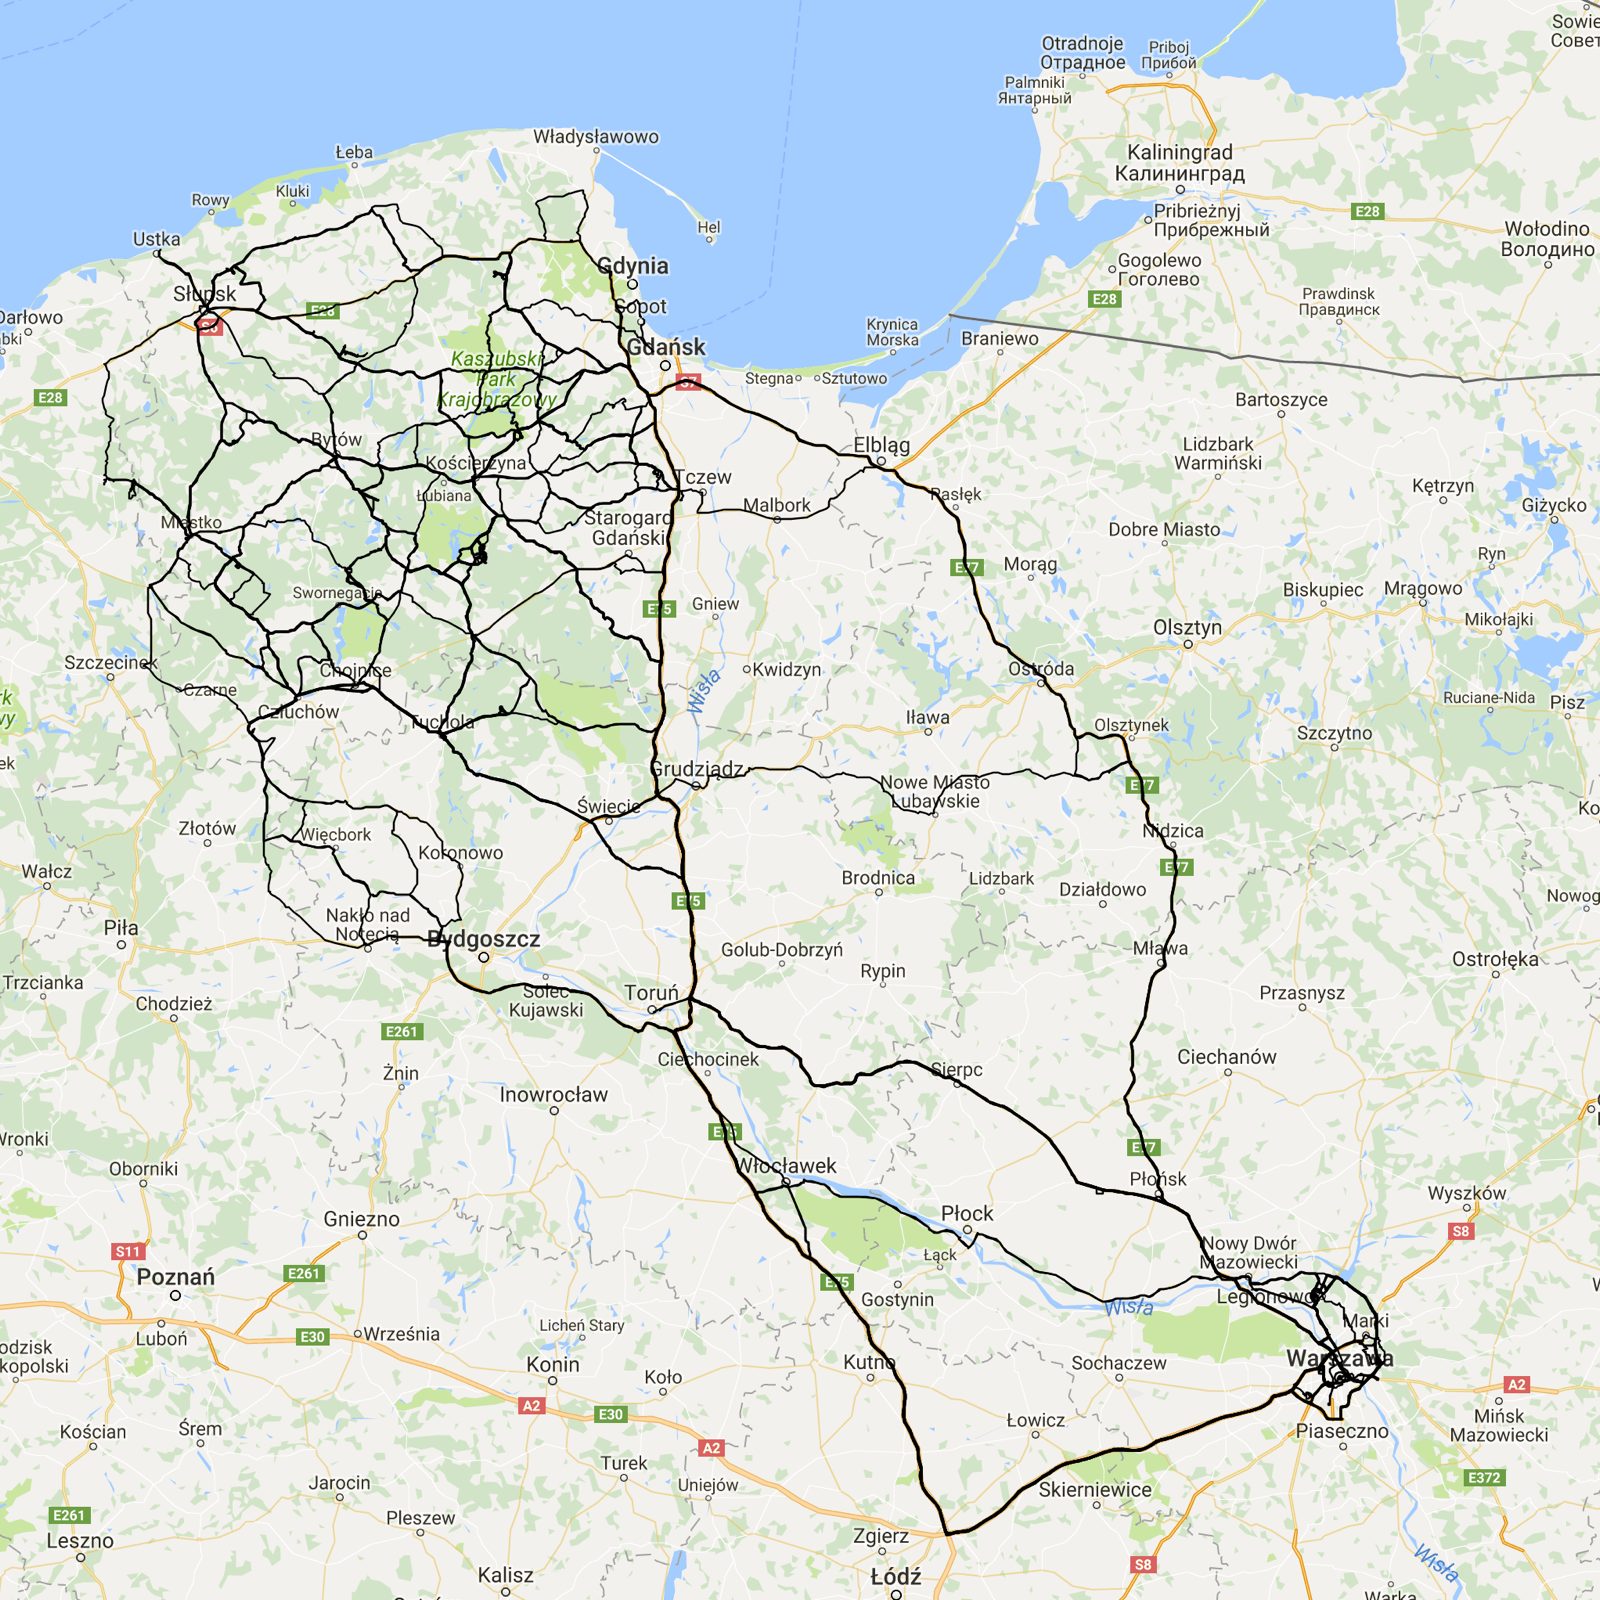
Altogether there were 27 trips, and the total distance exceeded 31 thousand kilometers. The track log contains over one and a half million points, which adds up to more than 400 hours of driving (16 hours per trip on average). It's a beautiful dataset that just begs to be visualized on a map. Of course, I wouldn't be myself if I didn't first load all the data into Matlab (after every trip I always loaded the log into Matlab and used a script to generate a report of all the route segments: from where to where, and from when to when). A bare visualization of the data is very pretty, but only putting the routes on a map gives you the full picture. For that I naturally used Google Maps. From Matlab I saved my tracks to a KML file (remembering to put a NaN at the end of each segment, so that there'd be a break between segments when drawing) and uploaded it to Google Maps (after logging in, go to Your places and My Maps, where you can upload a KML file). The file with all my data was over 40 MB, so to stay within Google's limit (max 5 MB) I took every 10th point when saving. Here's what it looks like:
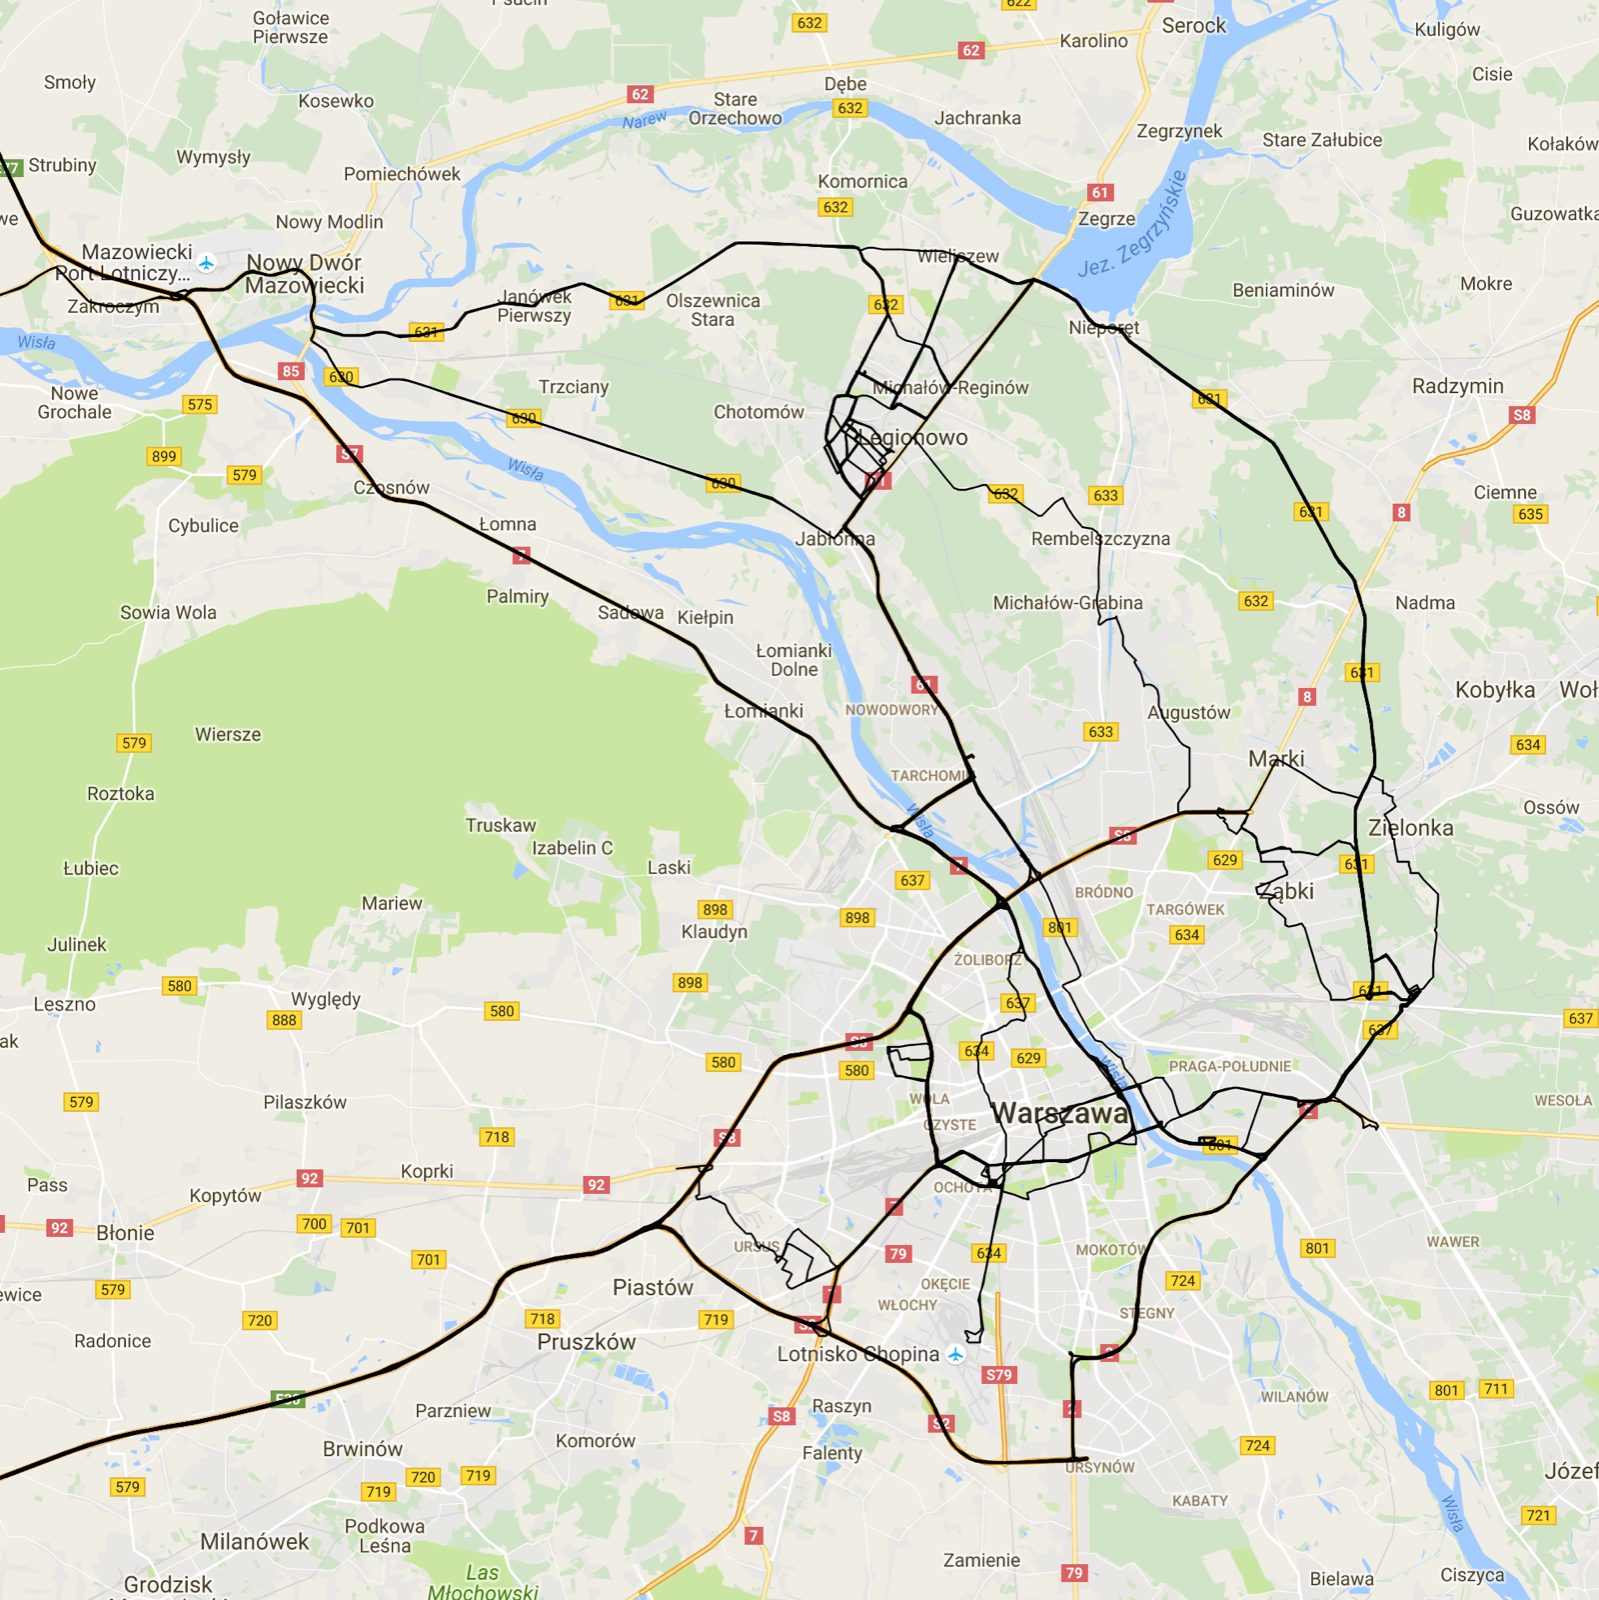
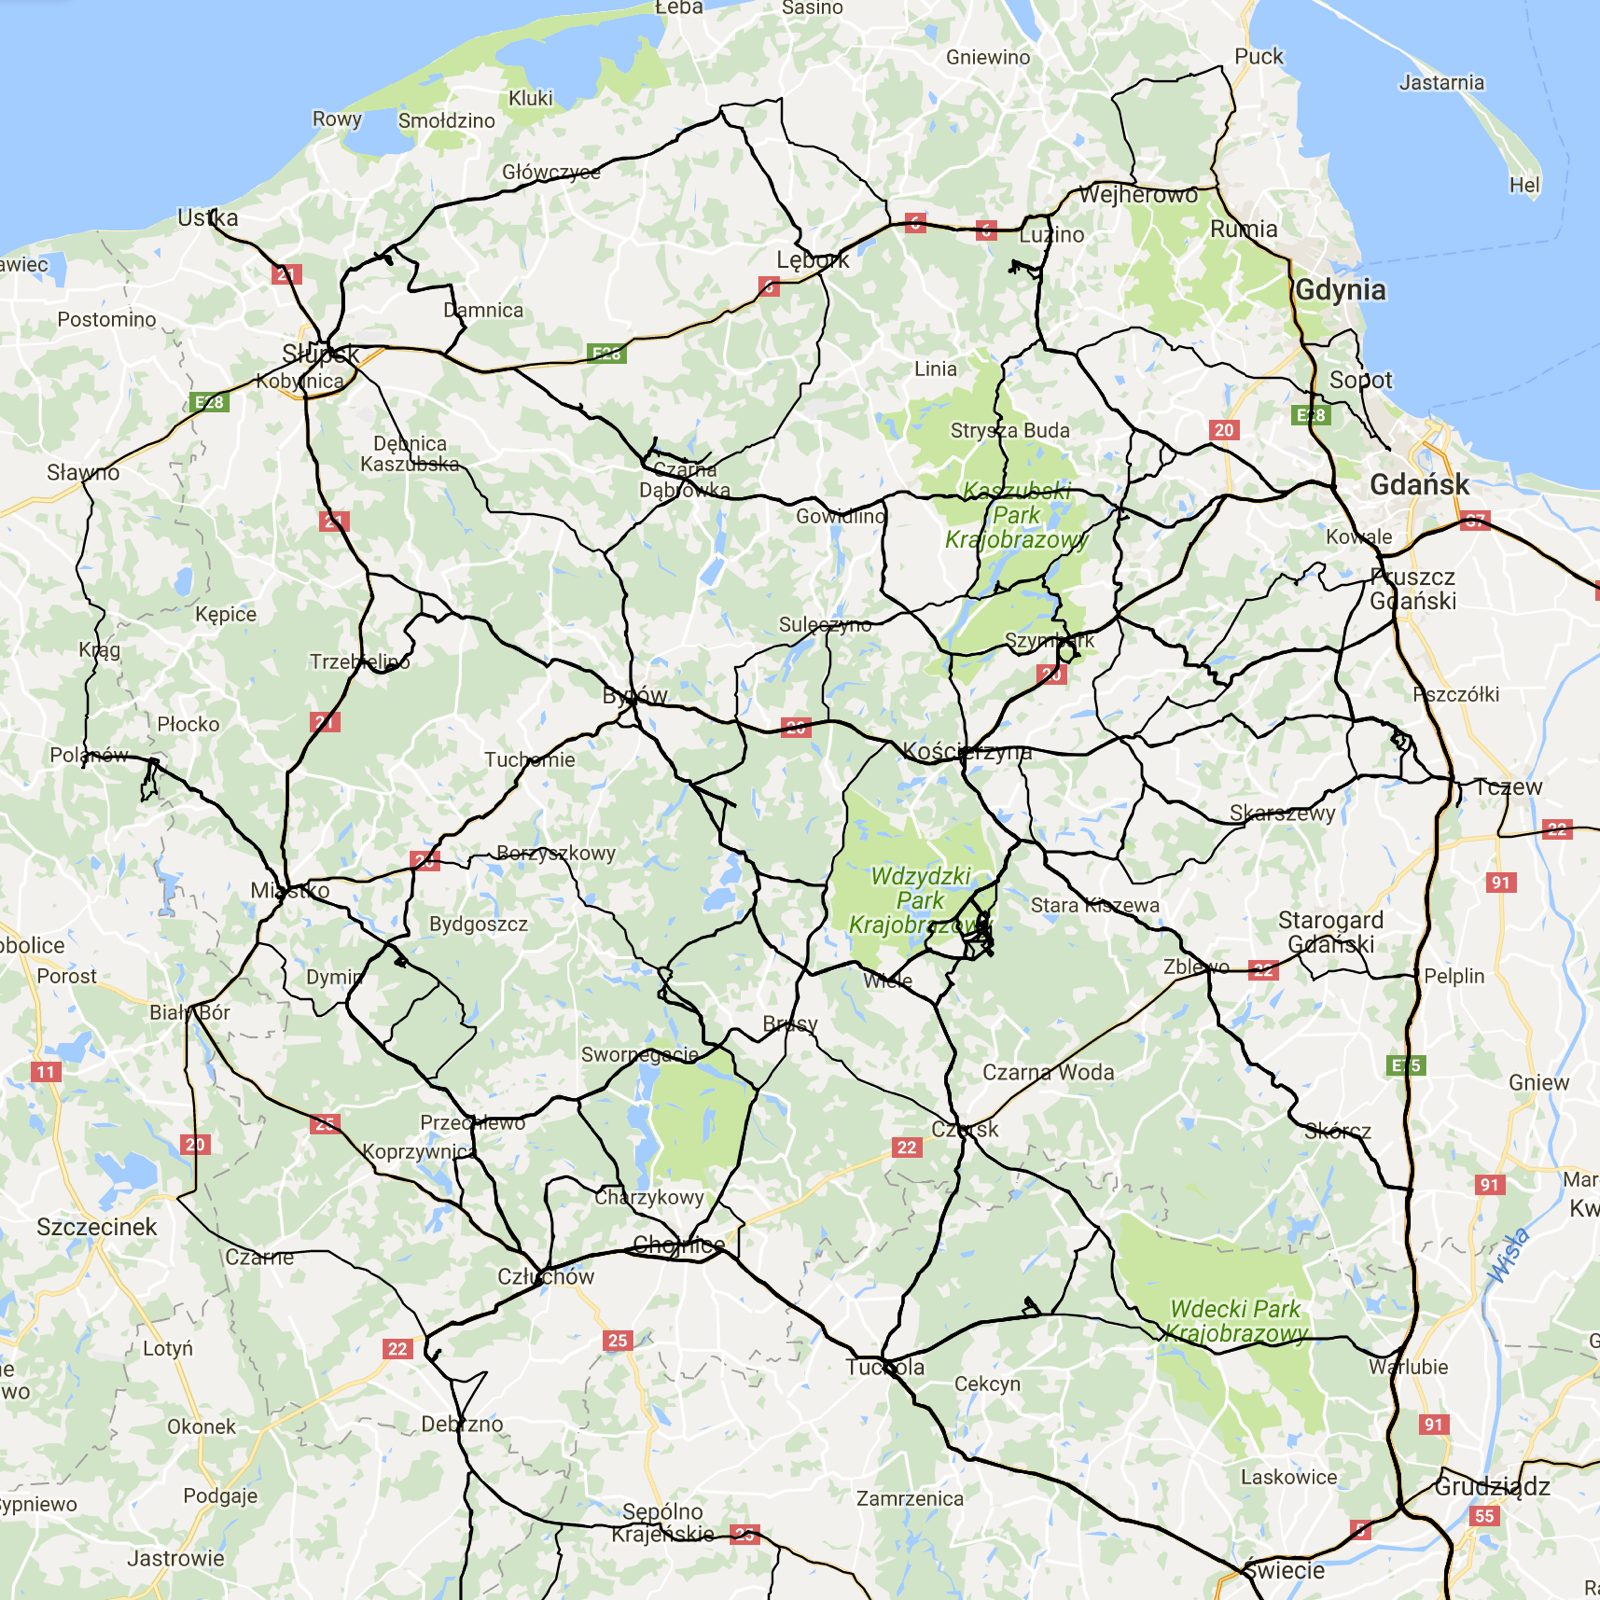
A close-up of the start and destination areas:
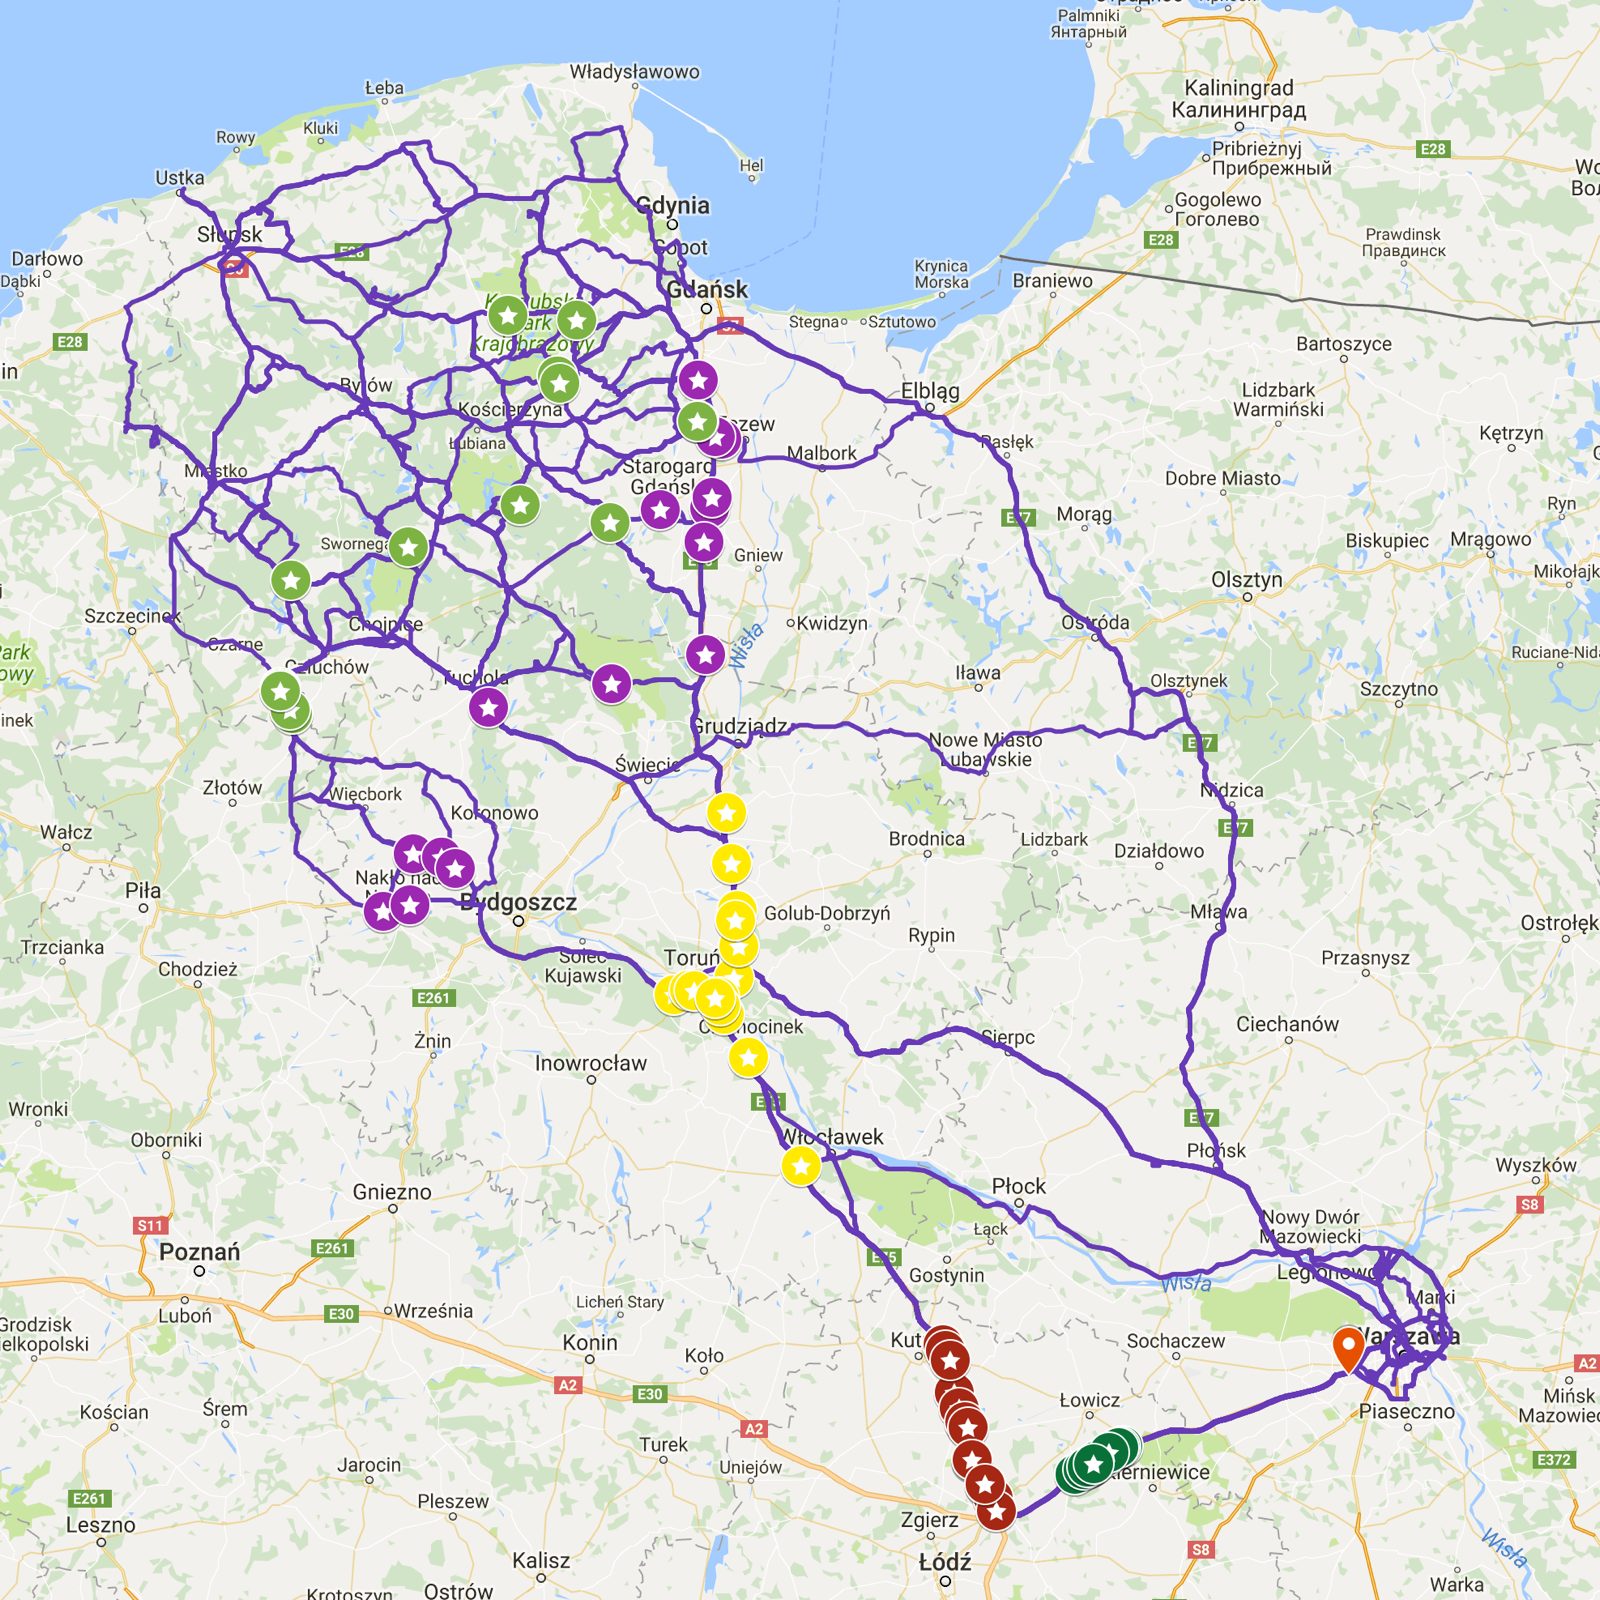
It's worth pointing out that during our first trips (the first one was in 2012), the A1 motorway was still under construction on the section from Łódź to Toruń. At this point an idea came to mind. Since more than half of my trips went precisely via the A2 and A1 motorways, I did a simple analysis. For each trip along this route, I took the time of passing a common point (just after the junction of the S8 and A2 near Warsaw, the orange marker on the map) and marked the position after 30 (green), 60 (brown), 120 (yellow), 180 (purple) and 240 minutes (light green). Of course I drove at different times of day, sometimes with a stop for fuel, in different conditions and so on, but you can clearly see that the farther you go, the bigger the spread:
Quite by the way, while writing this post I fell in love with Google Maps all over again. Another important advantage of a Google map like this is that you can load the map with the overlaid routes in the app on your phone, which makes navigation much easier, e.g. when retracing a route through a forest. I'll try to write more about this someday.
Bonus! I recorded one of the drives in its entirety with an action camera (like a GoPro, but from Sony):